Several altcoins have relinquished their recent gains this week amidst escalating geopolitical tensions, with Polkadot (DOT) encountering similar challenges. The latest market correction saw the altcoin’s price plummet to $4.04, marking a decline of over 14% in just three days.
During times of market volatility, it is crucial to reassess key fundamentals and evaluate traders’ sentiment in light of insights from renowned industry analysts.
### Polkadot On-Chain Metrics
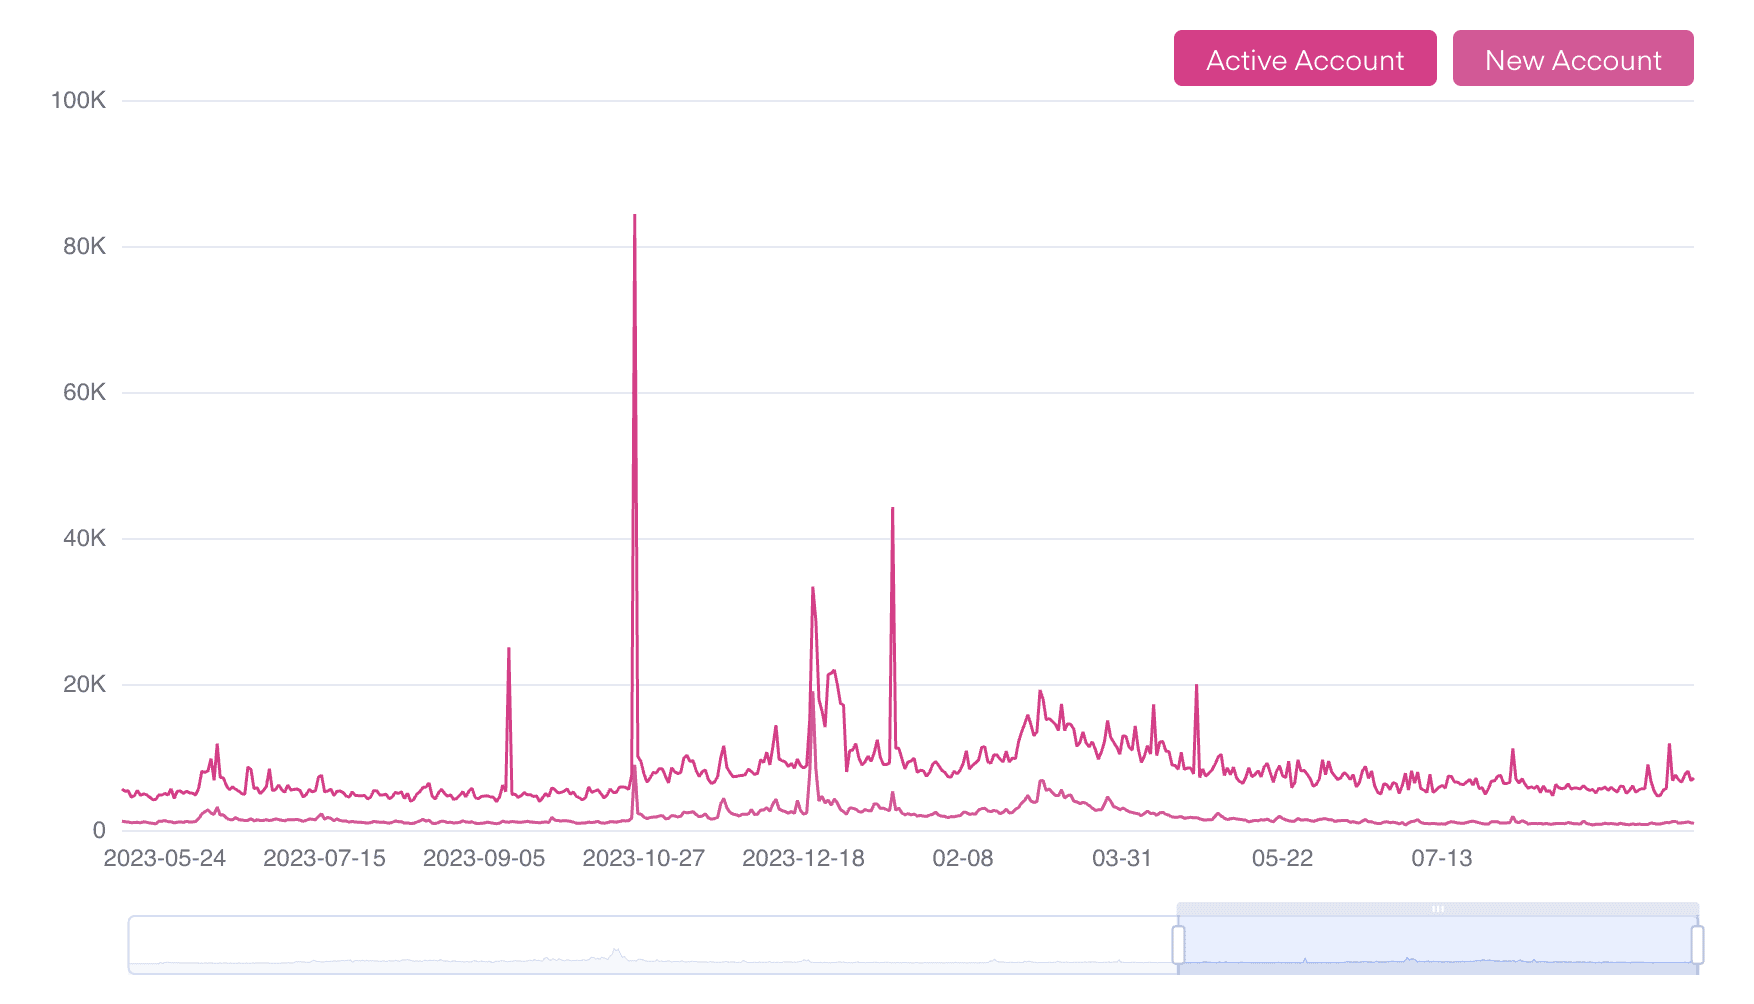
One of the critical on-chain metrics that provide insights into Polkadot’s network activity is the number of daily active users and new users onboarded to the ecosystem.
While the number of new accounts created on Polkadot has remained relatively stable since May last year, the count of active users has surged by more than 25%.

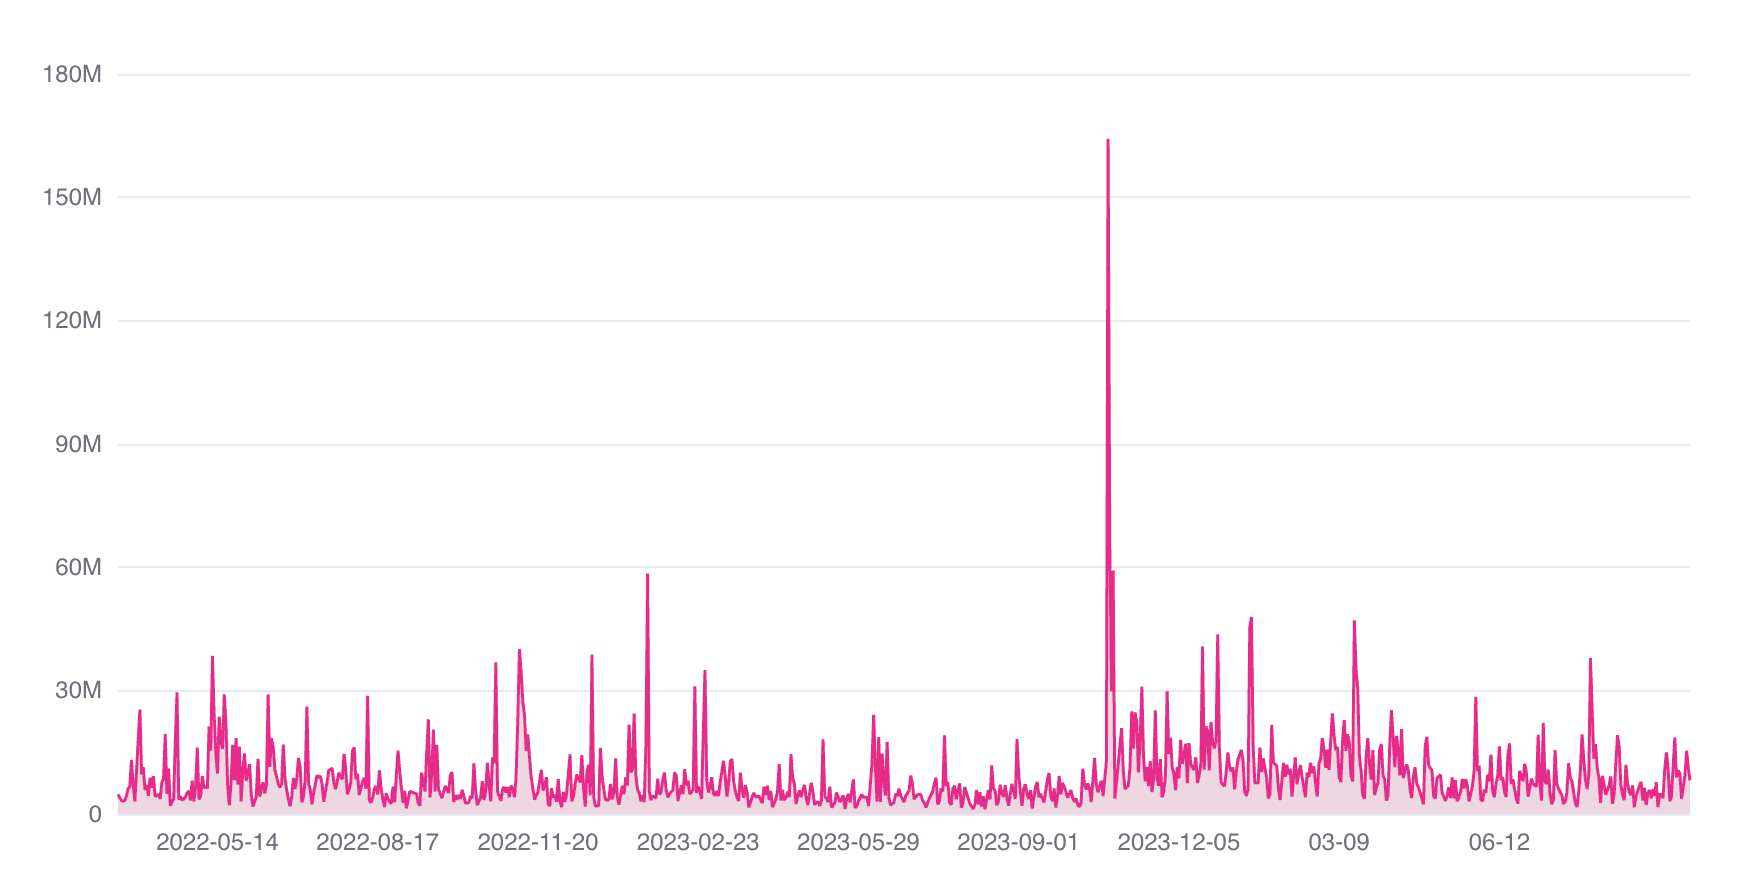
Moreover, the daily volume of DOT tokens transacted has seen a significant uptick during this period, indicating an uptrend in transaction volumes processed on the network.

### DOT’s Imminent Breakout – Preparedness of Investors
A recent analysis suggests that DOT is on the brink of a substantial breakout. The altcoin seems to be nearing the end of its accumulation phase and could potentially break out of a long-established falling wedge pattern.
Based on the analysis, recent movements in major large-cap cryptocurrencies hint towards a potential upward trend for DOT, with projected breakout targets identified at $11.83, $18.41, $26.30, and $37.53, highlighting key resistance levels.
“With over 600 days residing below the key zone, Polkadot is gearing up for a significant push.” – Market Analyst
Another notable market observer, Lucky, echoes a positive outlook for DOT in his technical analysis, suggesting that the asset is approaching the culmination of its annual accumulation phase, signaling a potential uptrend for DOT’s price movement in the near future.
### An Optimistic Outlook Rooted in Historical Patterns
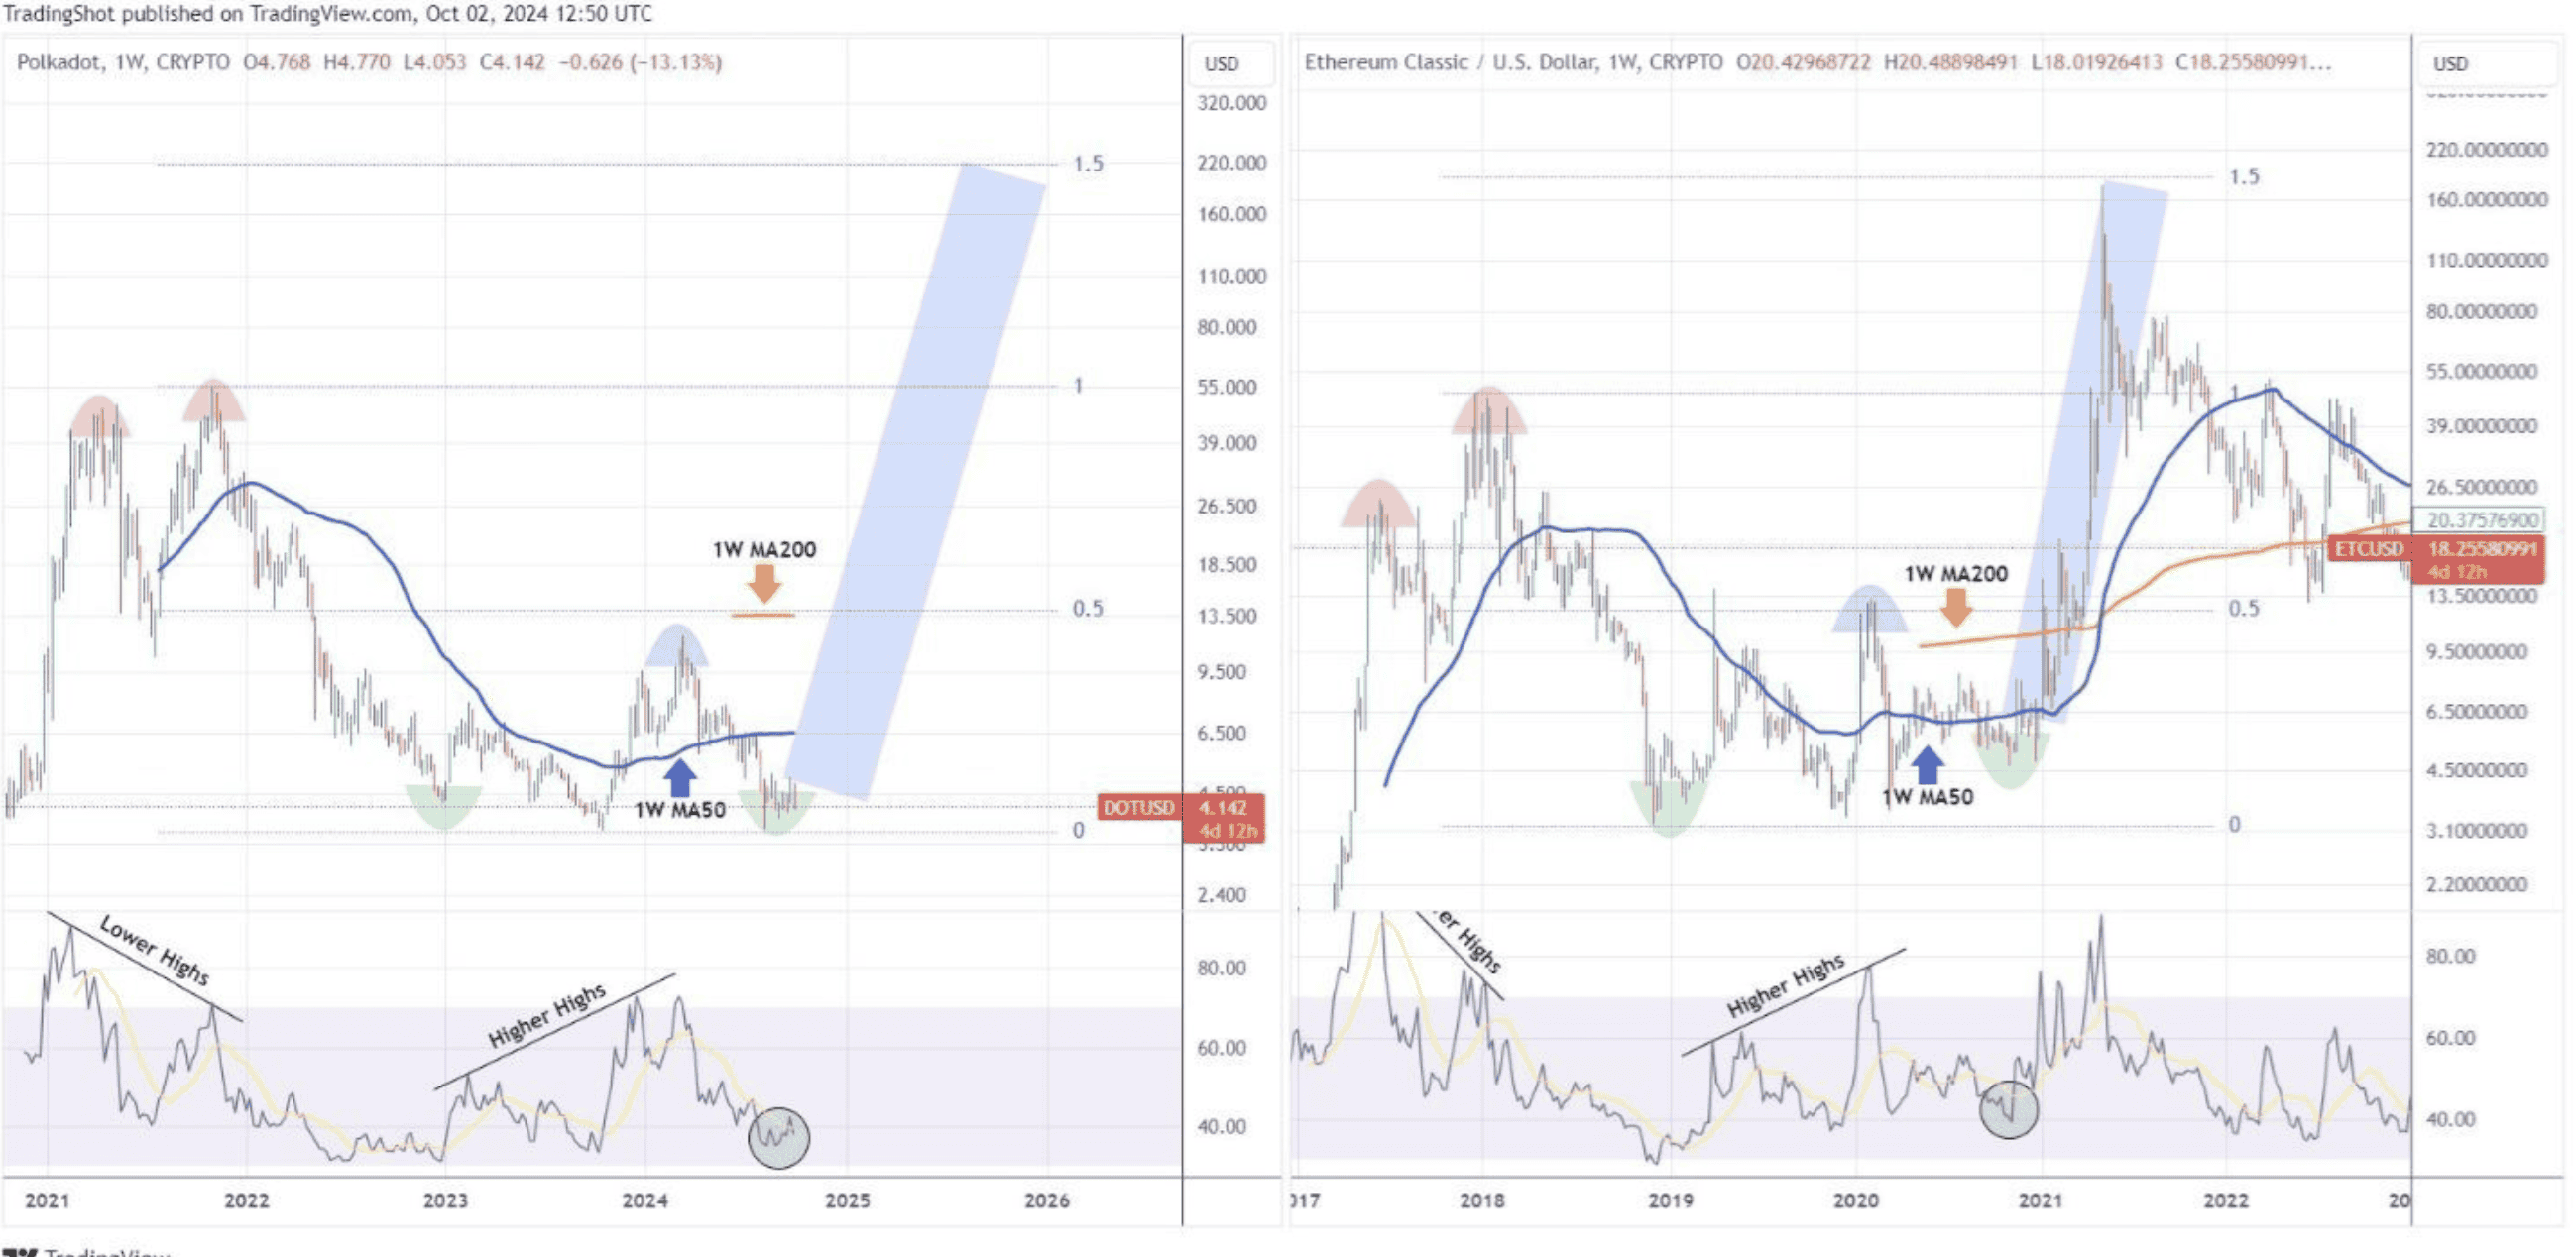
According to the investment firm TradingShot’s analysis, Polkadot could be on track for a major price surge, with the possibility of reaching $200 by the end of 2025. The analysis draws parallels between Polkadot and Ethereum Classic’s (ETC) 2018-2021 cycle, showcasing striking similarities in their RSI sequences.
Both assets exhibit comparable patterns of lower highs and double tops preceding a bear market, followed by an RSI bottom that triggers a breakout above the one-week MA50 and the 0.5 Fibonacci retracement level.

Currently, Polkadot’s RSI hovers around 40.00, a critical level that previously marked the onset of a parabolic rally in Ethereum Classic. If Polkadot mirrors this historical cycle, it could potentially surge towards the 1.5 Fibonacci extension, reaching $200 by late 2025.


