BTC continued its downtrend into the green zone, aligning with the prediction made in the “Will it start falling until halving?” analysis.
Yesterday’s analysis resulted in a gain of over 15% for readers.
The current BTC chart reflects buying activity within the green support range.
BTC’s downward movement persisted into the green zone as anticipated in the analysis, delivering a gain of more than 15% from yesterday. The price is now showing signs of recovery with support in the green range of $66,666 – $65,800.
MEDIUM TERM BTC ANALYSIS
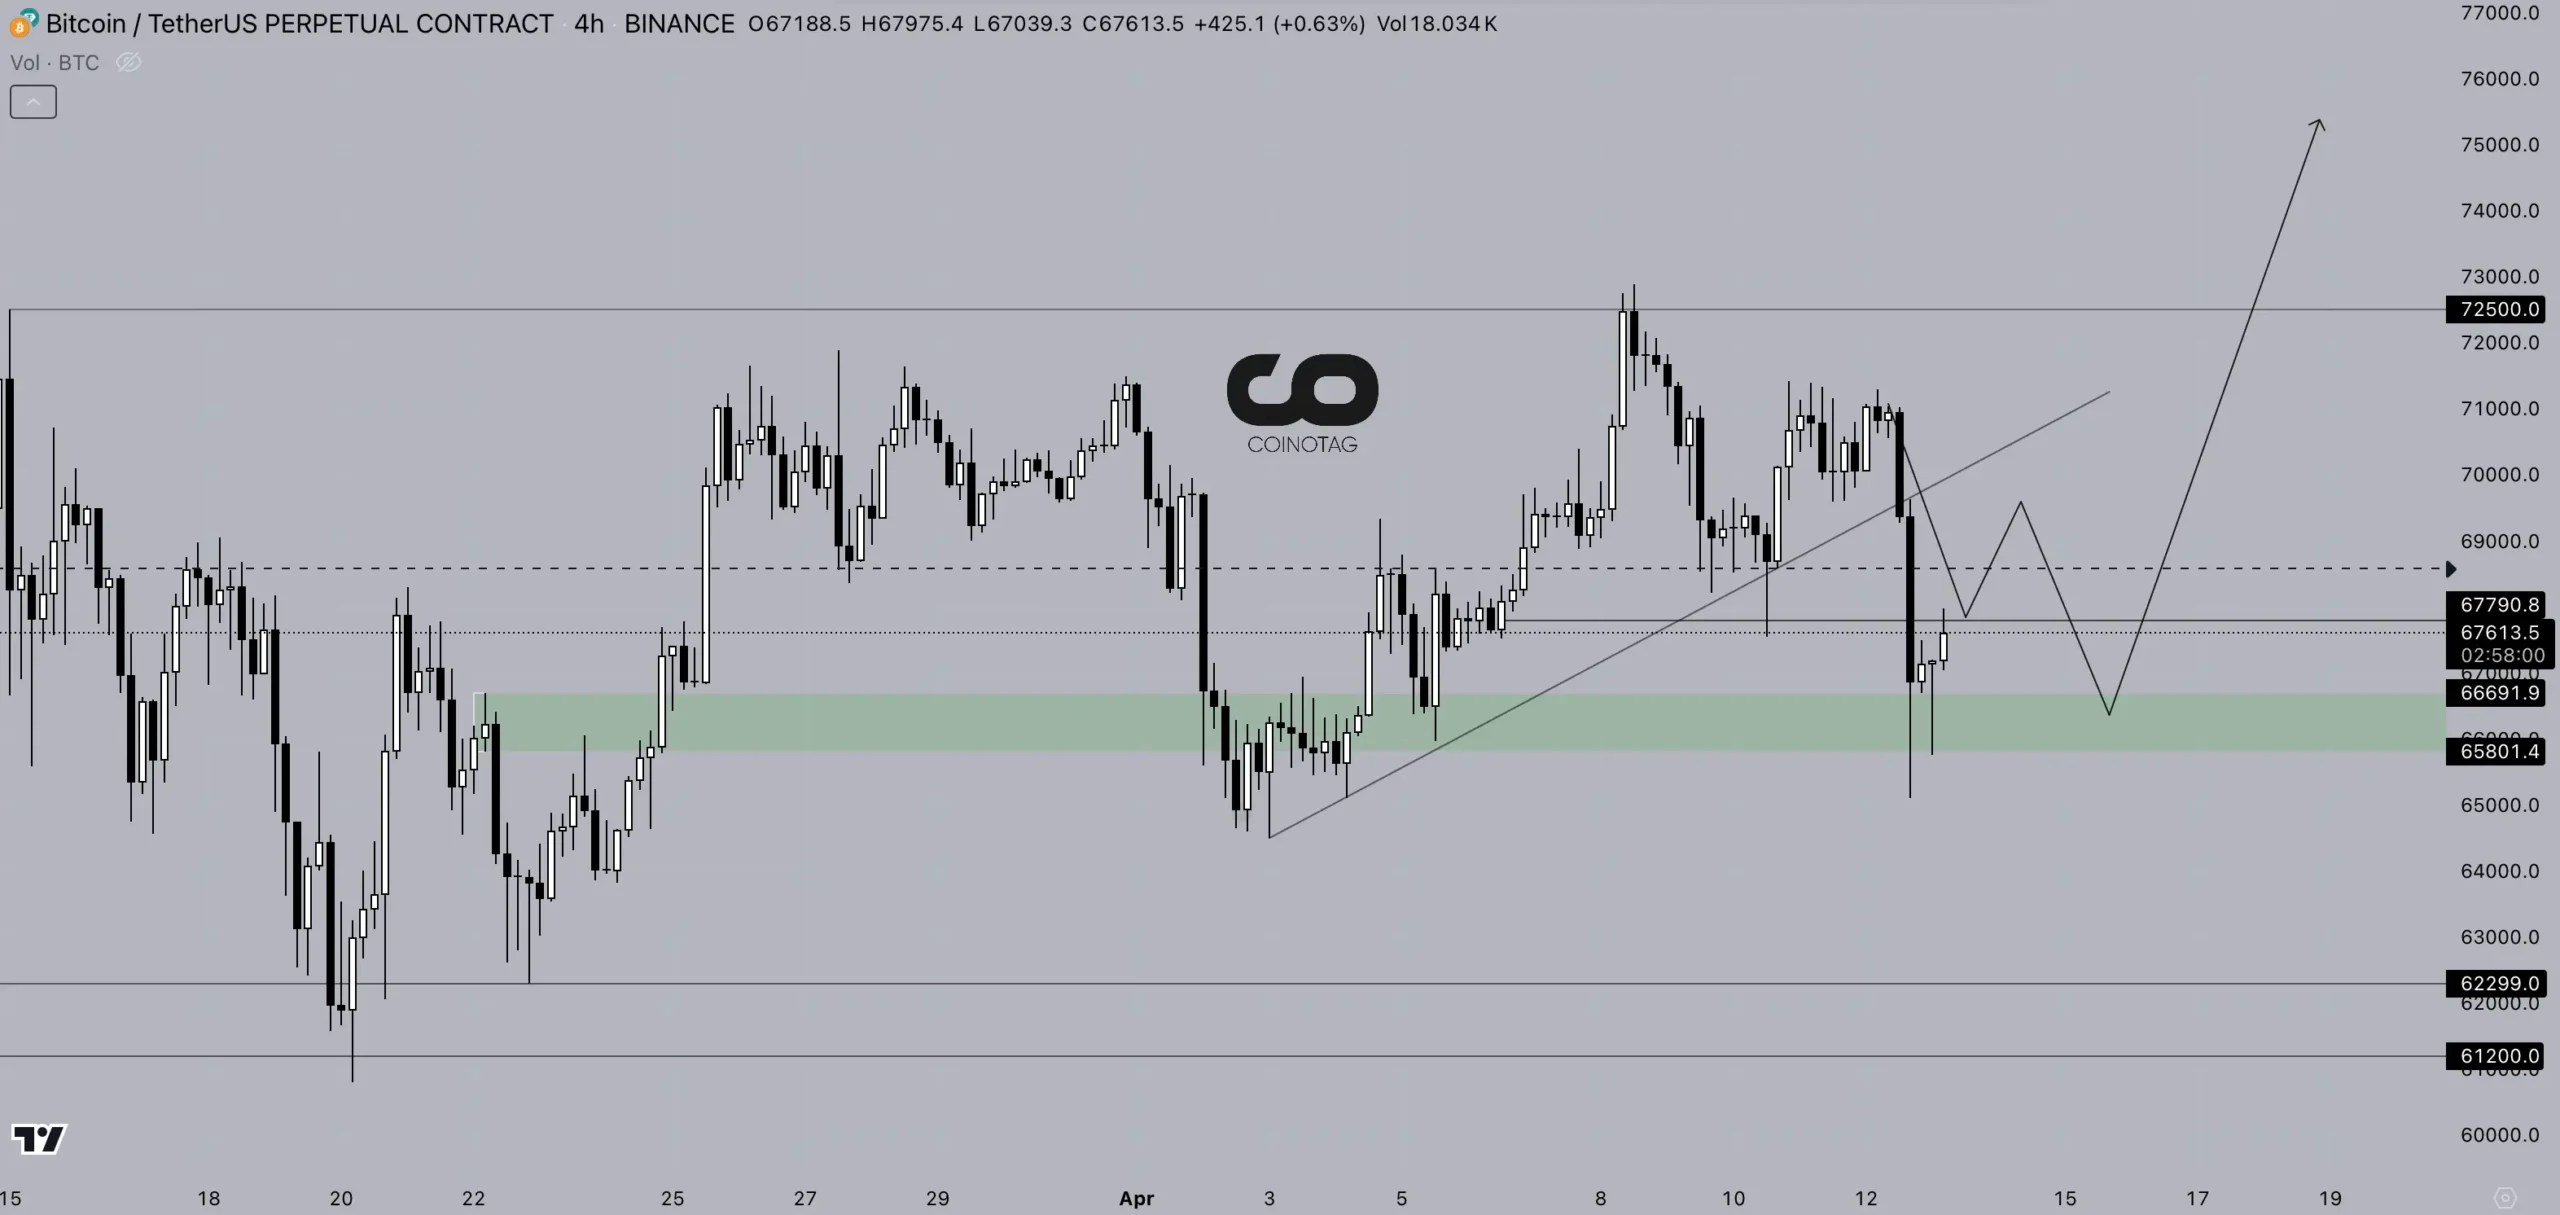
4-Hour BTC/USDT Chart
Based on Bitcoin’s 4-hour technical chart, the expected movement outlined in yesterday’s analysis has been realized, with BTC continuing its downtrend into the green zone.
Yesterday’s analysis yielded a gain of more than 15% for traders. The current BTC chart indicates a potential rebound from the green support range mentioned in the analysis, ranging from $66,666 to $65,800.
Referring back to the analysis from April 12, it is anticipated that BTC price might consolidate in the green zone and aim for $75,000 as long as it remains above the green support region. However, a breach below this level, with a 4-hour candle closing below $65,000, could serve as a stop-loss point.