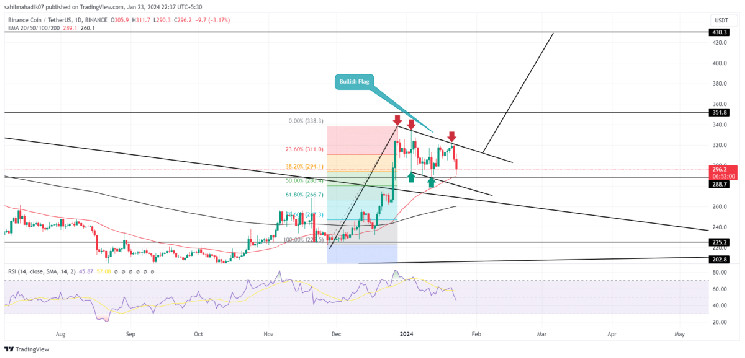
In the current market downturn, the price of BNB, the native token of Binance, has remained strong above the crucial $285 support level. Despite this, a bullish flag formation on its daily chart indicates a potential for buyers to regain momentum and push the token to higher levels.
Recent reversal from the flag pattern resistance suggests that the BNB price may continue to correct. Traders are likely to face pressure at $295 and $280, according to the Fibonacci retracement tool. The intraday trading volume in the BNB coin is $1.027 Billion, signaling a 20% gain.
The price of Binance Coin has shown significant volatility within a flag pattern over the past month. While the trendlines within this pattern suggest a correction phase, the coin’s ability to maintain its value above the 38.2% Fibonacci retracement level hints at an unbroken recovery trend.
When Bitcoin’s price fell below $40,000, the broader crypto market faced increased selling pressure, leading to a correction across major cryptocurrencies. During this sell-off, BNB’s price declined by 7.85% over the last 48 hours, dropping from $320 to $295.
Despite ongoing supply pressures and the potential risk of BNB’s price dipping to $280, buyers still have a chance to reverse the trend as long as the flag pattern remains valid. A breakout above the pattern’s resistance trendline would indicate an uptrend continuation, potentially elevating the coin’s value to $430.
The December rally marked a significant breakout for the BNB price from the resistance trendline of a symmetrical triangle pattern that had been forming over two years. This breakout signals a shift in market dynamics, providing an opportunity for buyers to re-enter the market and continue the recovery trend. Following the trajectory suggested by the triangle pattern, there’s a potential for BNB’s price to target a high of around $560.
In terms of technical indicators, the RSI slope below 50% reflects aggressive selling momentum, but a bullish alignment between the daily EMAs (20, 50, 100, and 200) indicates a positive broader trend.
For further reading in the crypto and NFT space, check out these related articles on Binance and market developments.